| Back to . . . | This page . . . |
R E P R I N T [PDF version (664 kilobytes)]
Following the abstract are links to QuickTime movies that illustrate the figures in the paper, and also to high-resolution jpegs of those figures.
Two overviews of this article can be found in Ivars Peterson’s online columns in Science News Online (MATHTREK: 21 August 2004) and Science News for Kids (MUSE: January 2005).
Two more overviews, by science writer Dana Mackenzie, can be found in Science magazine (“Whatever floats your paraboloid”, Volume 305, Number 5687, 20 August 2004, page 1102) and in Discover magazine (“Tilt”, Volume 26, Number 07, July 2005, pages 36-37).
Another overview as it applies to the stability of kayaks was printed in Mountain Gazette magazine (“The occupation of floating bodies” by B. Frank, Number 123, April 2006).
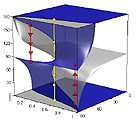
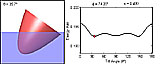
[Remark: The animated figure in the upper-lefthand corner illustrates the seven equilibrium positions (both stable and unstable)
of a floating paraboloid whose height is 0.88 times its diameter and whose relative density is 0.51. The seven tilt angles are
0°(base up), 32.4°, 61.4°, 95.8°, 118.7°, 140.8°, and 180°(base down).]
By Chris Rorres
Archimedes (c. 287 BC to 212/211 BC) lived in the Greek city-state of Syracuse, Sicily, up to the time that it was conquered by the Romans, a conquest that led to his death. Of his works that survive, the second of his two books of On Floating Bodies is considered his most mature work, commonly described as a tour de force. This book contains a detailed investigation of the stable equilibrium positions of floating right paraboloids of various shapes and relative densities, but restricted to the case when the base of the paraboloid lies either entirely above or entirely below the fluid surface.This paper summarizes the results of research in which I completed Archimedes’s investigation to include also the more complex cases when the base of the floating paraboloid is partially submerged. Modern scientific computing and computer graphics enabled me to construct a three-dimensional surface that summarizes all possible equilibrium positions (both stable and unstable) for all possible shapes and relative densities. This equilibrium surface contains folds and cusps that explain certain catastrophic phenomena— for example, the sudden tumbling of a melting iceberg or the toppling of a tall structure due to liquefaction of the ground beneath it— that have long been observed but not previously explained fully.
|
Equilibrium Surface (animations of Fig. 5 in paper)
In the following four movies the equilibrium tilt angles θ in [0°, 180°] are plotted for values of the base angle φ in [0°, 90°] and values of the relative density s in [0, 1]. The resulting equilibrium surface is shown in oblique view and rotates 360°. The movies are 450 x 450 pixels, 4-6 MB, 6 seconds, 180 frames, and 30 frames/second.
QuickTime Movie
: AS points in blue and US points in gray as shown in Fig. 5 of paper.
|
|
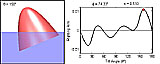
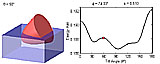
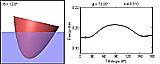
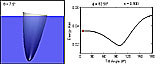
Righting-Arm Curve and Energy-Arm Curve (animations of Fig. 3 in paper)
In these four movies the righting arm or the energy arm is plotted for all values of the tilt angle θ. The paraboloid, which has base angle φ = 74.330° and relative density s = 0.510, is shown in a profile or an oblique view. All movies are 600 x 240 pixels, 4.5 MB, 12 seconds, 180 frames, and 15 frames/second.
QuickTime Movie
: Righting Arm vs. Tilt Angle (profile view of paraboloid)
|
|
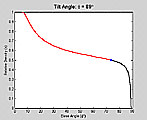
Tilt Angle Slices (animations of Fig. 7A-D in paper)
QuickTime Movie
|
|
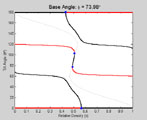
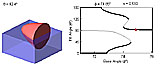
Base Angle Slices (animations of Fig. 7E-H in paper)
In these movies the base angle φ varies over the indicated values. The AS points are in black, the US points are in red, and the NS points are in blue. The light gray curve in the background is the projection of the curve of NS points onto the slice. All are 550 x 450 pixels and 15 frames/second.
QuickTime Movie :
φ varies from 0° to 90° in increments of 1°. (436 kb, 6 seconds, 91 frames)
|
|
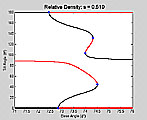
Relative Density Slices (animations of Fig. 7I-L in paper)
In these movies the relative density s varies over the indicated values. The AS points are in black, the US points are in red, and the NS points are in blue. All are 550 x 450 pixels, 6 seconds, 101 frames, 15 frames/second.
QuickTime Movie :
s varies from 0 to 1 in increments of 0.01. Base angle: 0° ≤ φ ≤ 90°. (545 kb)
|
|
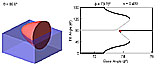
Hysteresis Loop (animations of Fig. 7J of the paper)
In these movies the relative density s of a paraboloid is kept fixed at 0.499 and its base angle φ oscillates between 73.76°. and 74.42°, changing by increments of ±0.02°. Both movies are 600 x 240 pixels, 1.5 MB, 4 seconds, 66 frames, and 15 frames/second.
QuickTime Movie
QuickTime Movie |
|
Turning a Paraboloid Upside-Down (animations of Fig. 7L of paper)
In these movies the relative density s of a paraboloid is kept fixed at 0.510 and its base angle φ goes from 72° to 75° and then back to 72°. The tilt angle θ starts at 0° and ends up at 180° after undergoing two jumps at 42.4° (to 93.4°) and 98.8° (to 145.3°). All are 600 x 240 pixels, 2.8 MB, 8 seconds, 121 frames, and15 frames/second.
QuickTime Movie
QuickTime Movie
QuickTime Movie |
|
Tumbling Iceberg (animations of Fig. 8 of the paper)
QuickTime Movie
QuickTime Movie |
|
Toppling Structure due to Soil Liquefaction (animation of Fig. 9 of the paper)
QuickTime Movie
|
Click on a thumbview below to view or download a high-resolution JPEG file of any of the nine figures in the paper.
These figures are copyrighted by Springer Publishing House and should not be reproduced elsewhere without permission.
Fig. 1: 2285 x 697 pixels, 151 kilobytes 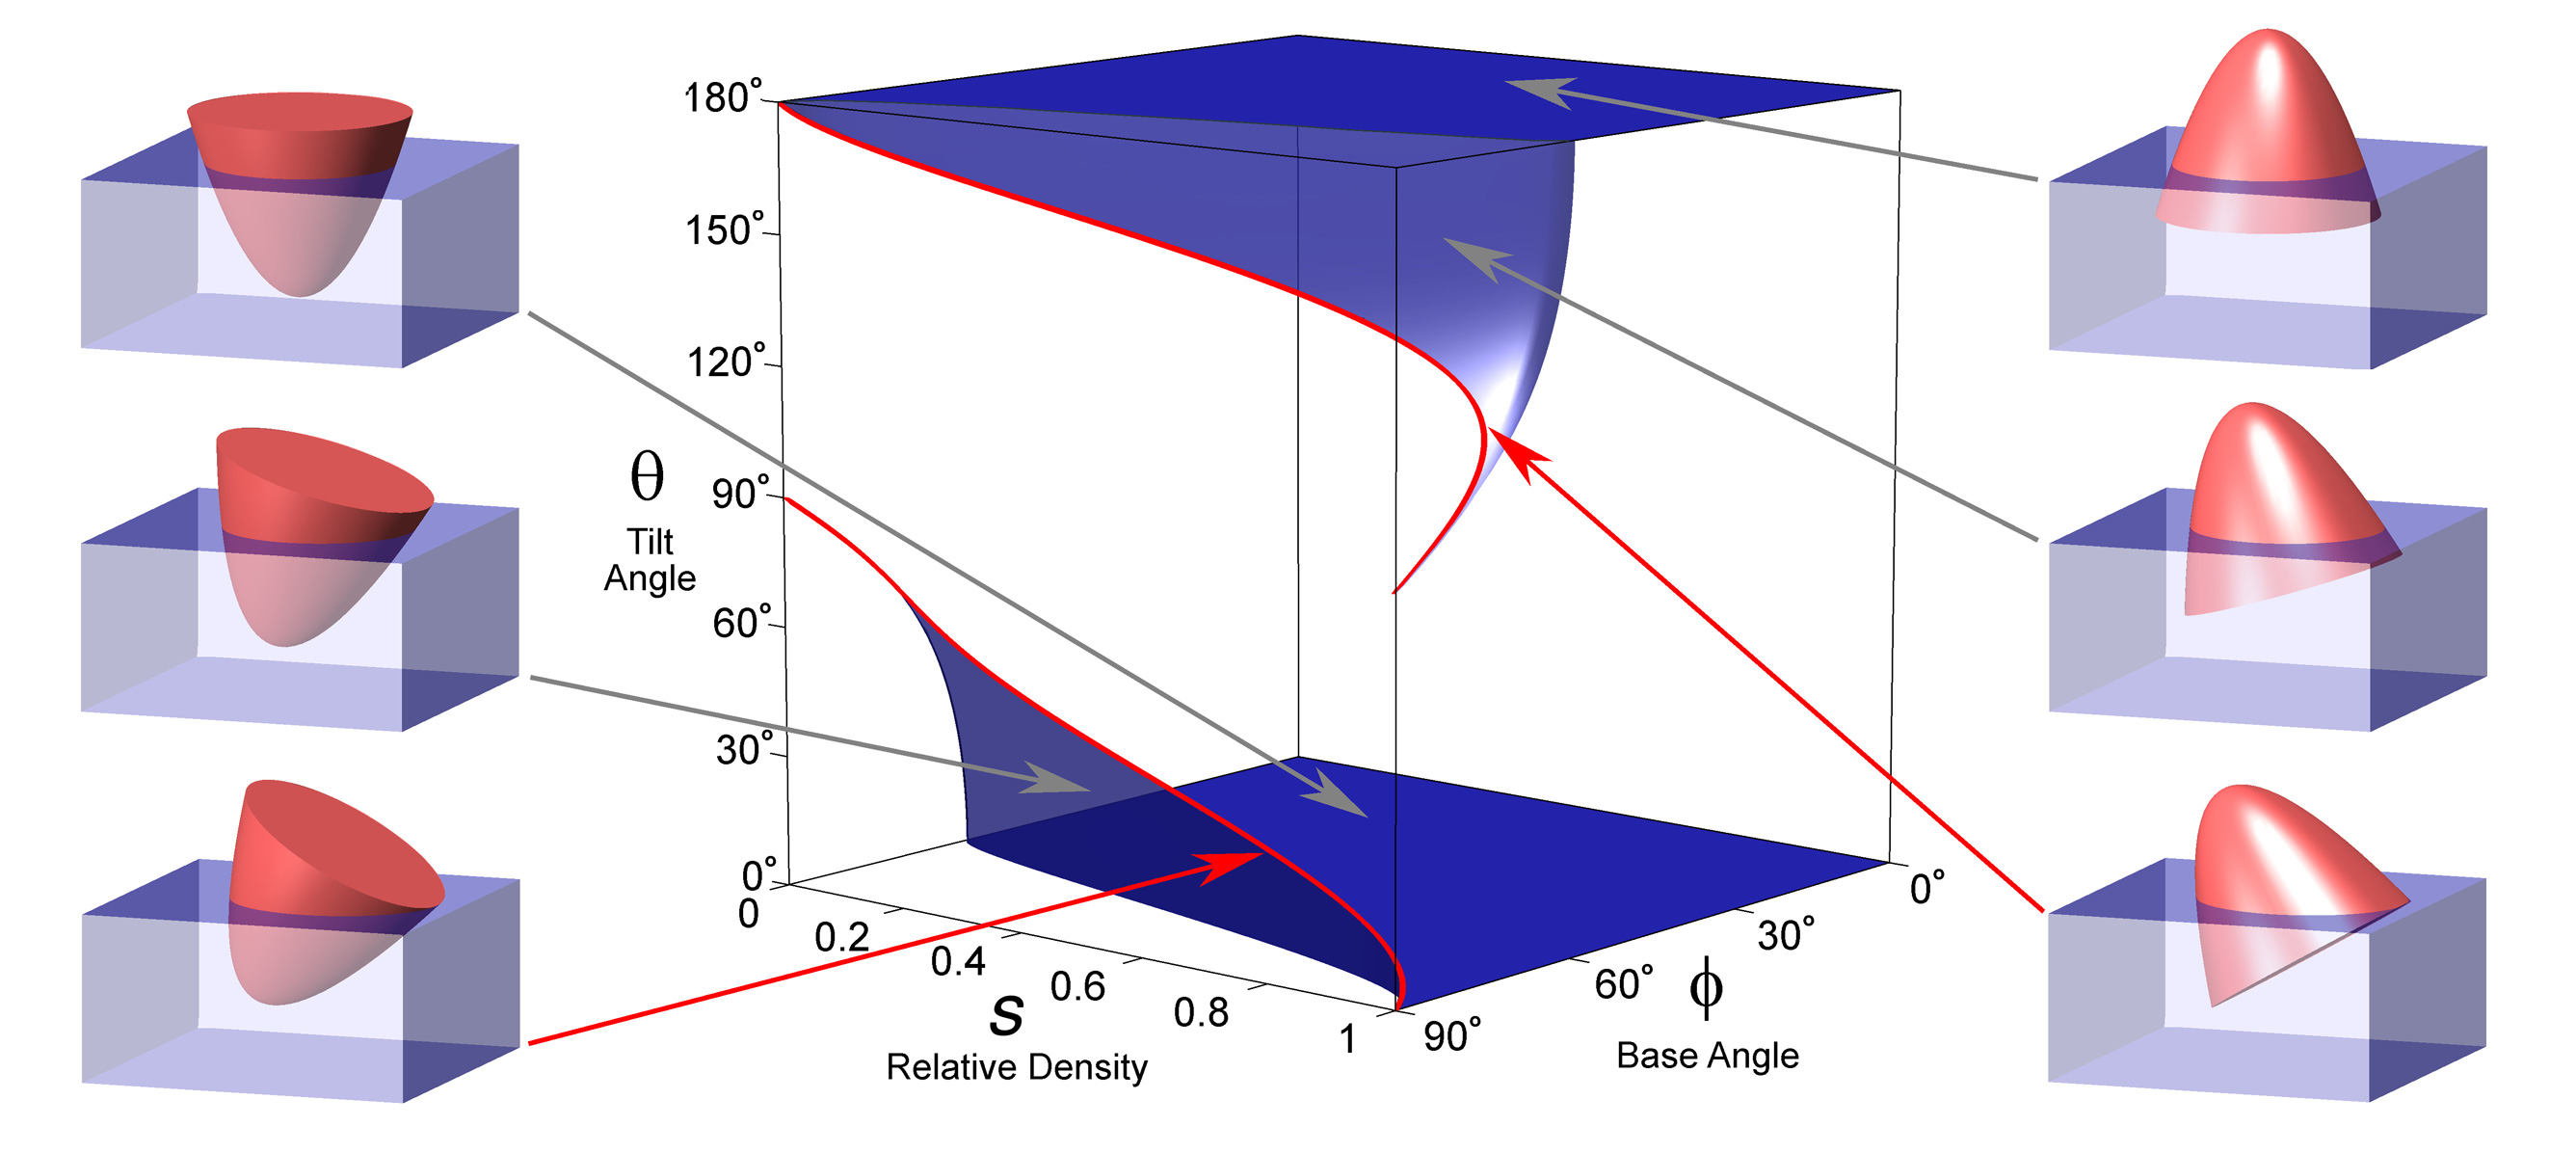
Fig. 4: 2673 x 1196 pixels, 389 kilobytes 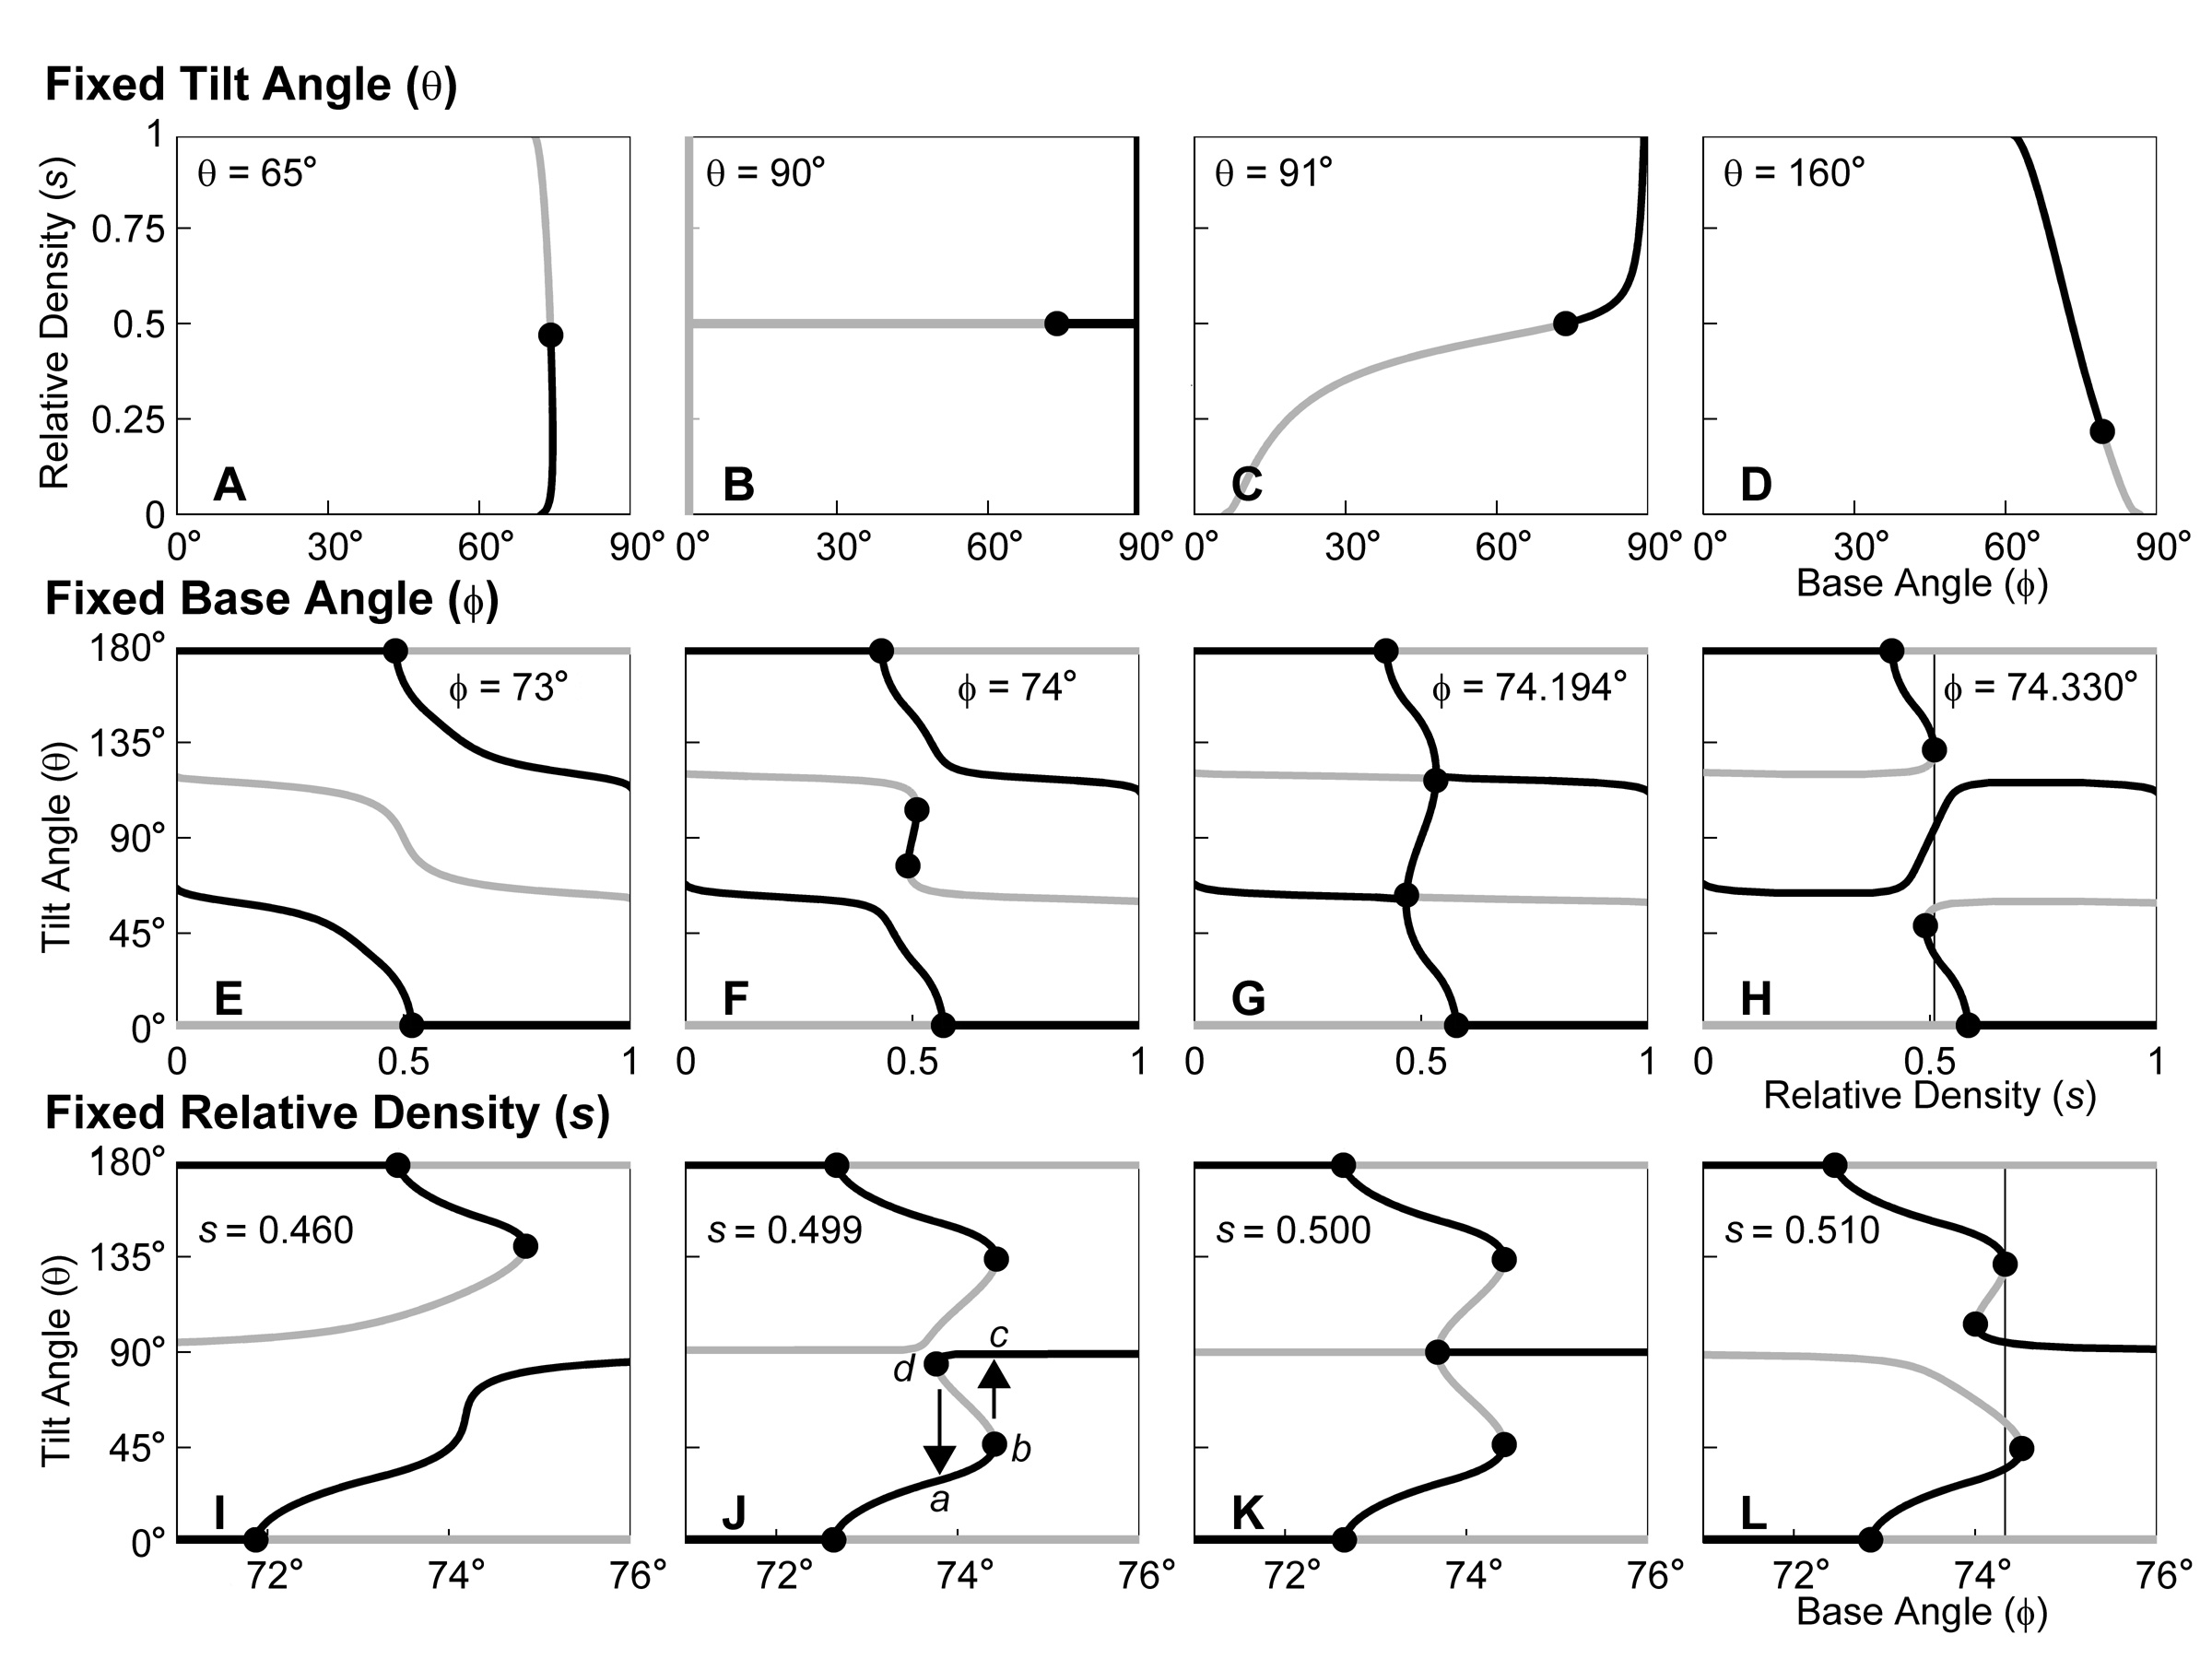
Fig. 7: 2400 x 1800 pixels, 446 kilobytes |
Fig. 2: 913 x 302 pixels, 23 kilobytes 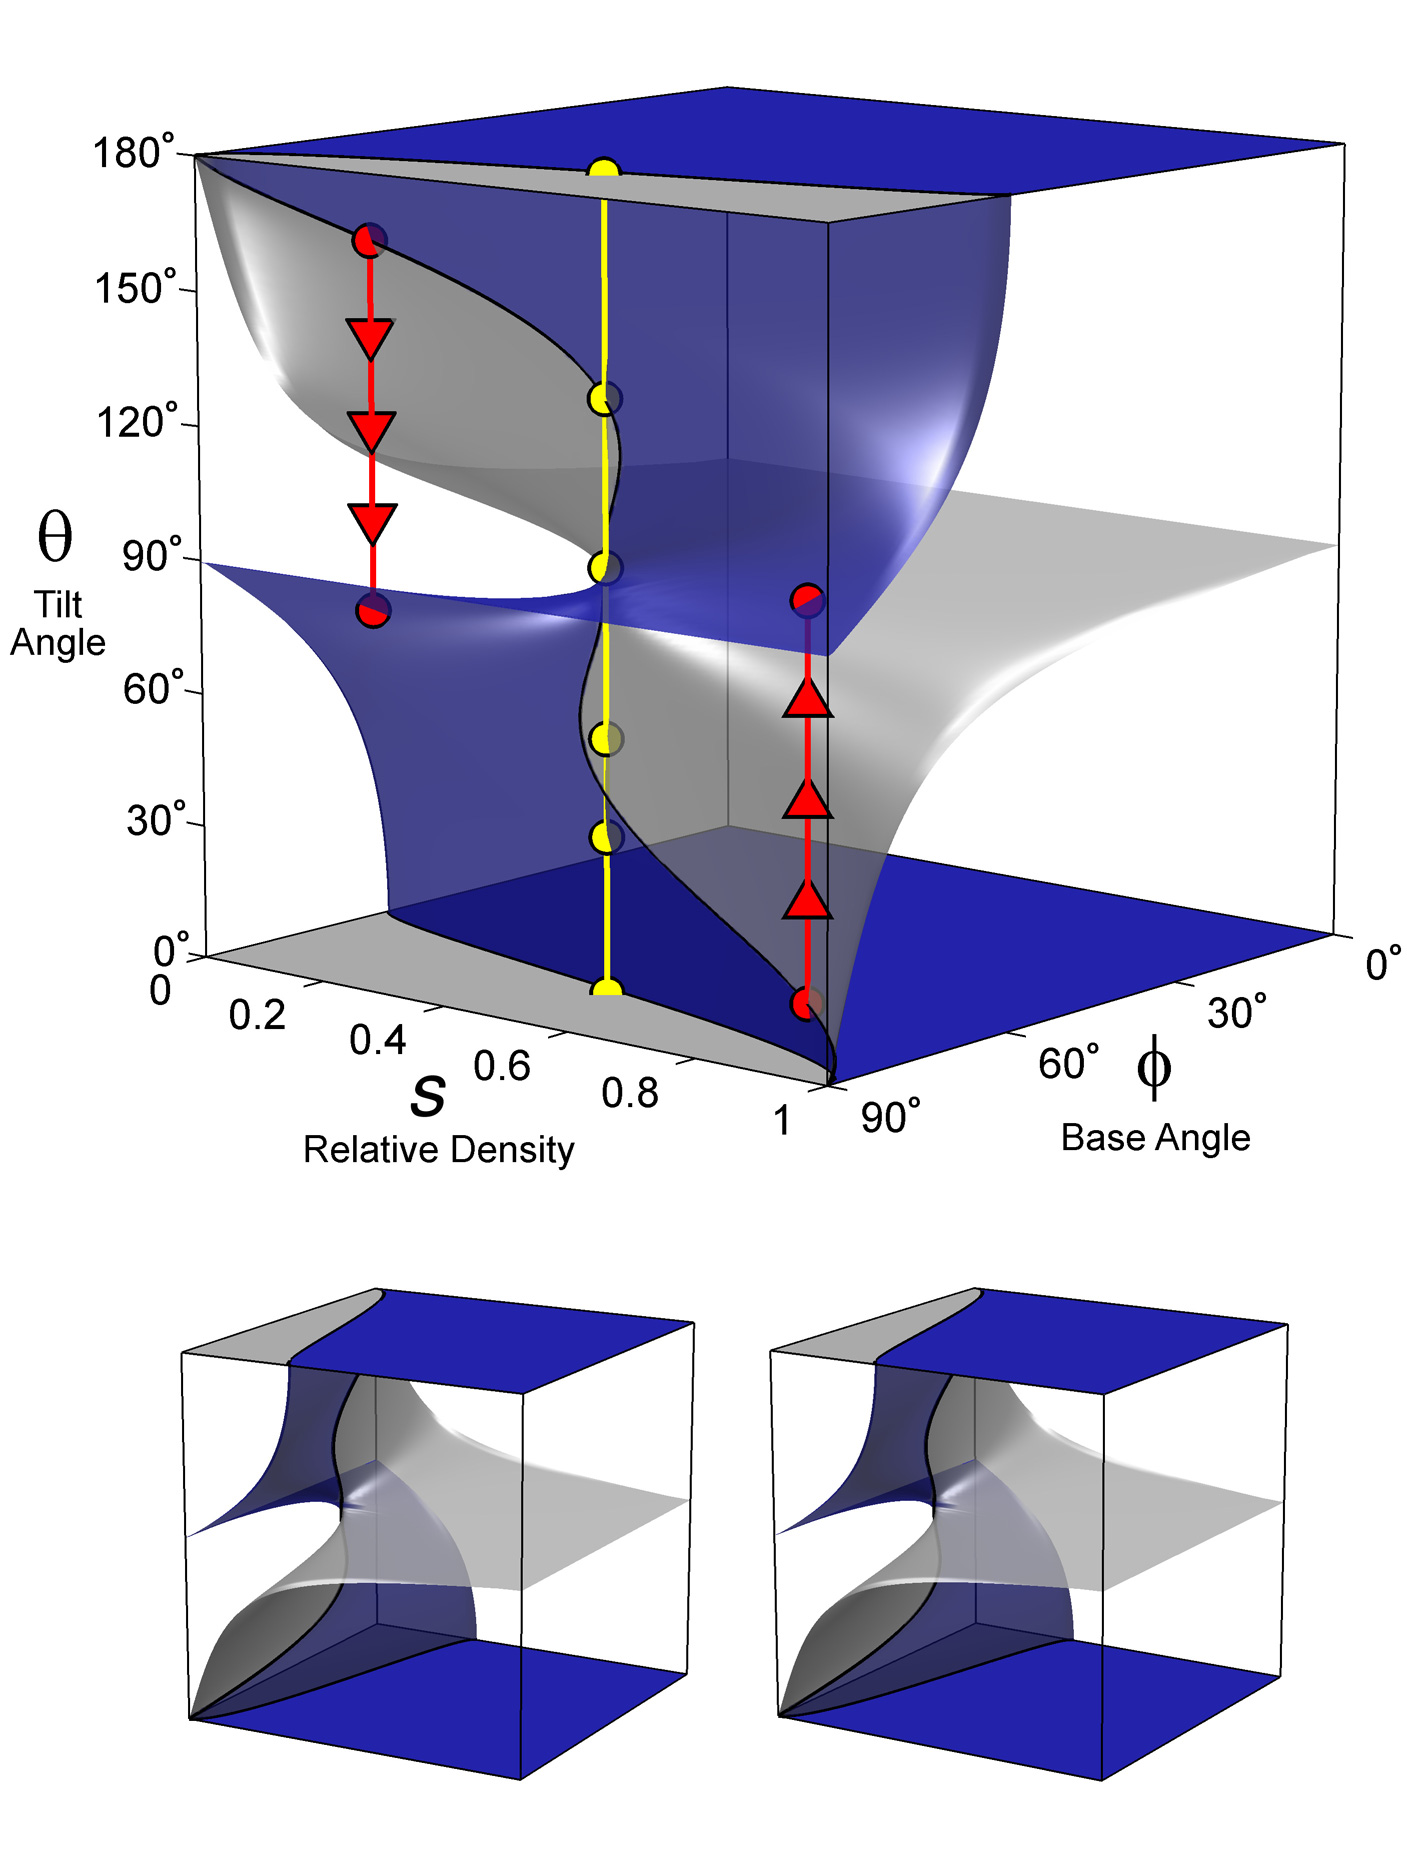
Fig. 5: 1407 x 1876 pixels, 318 kilobytes 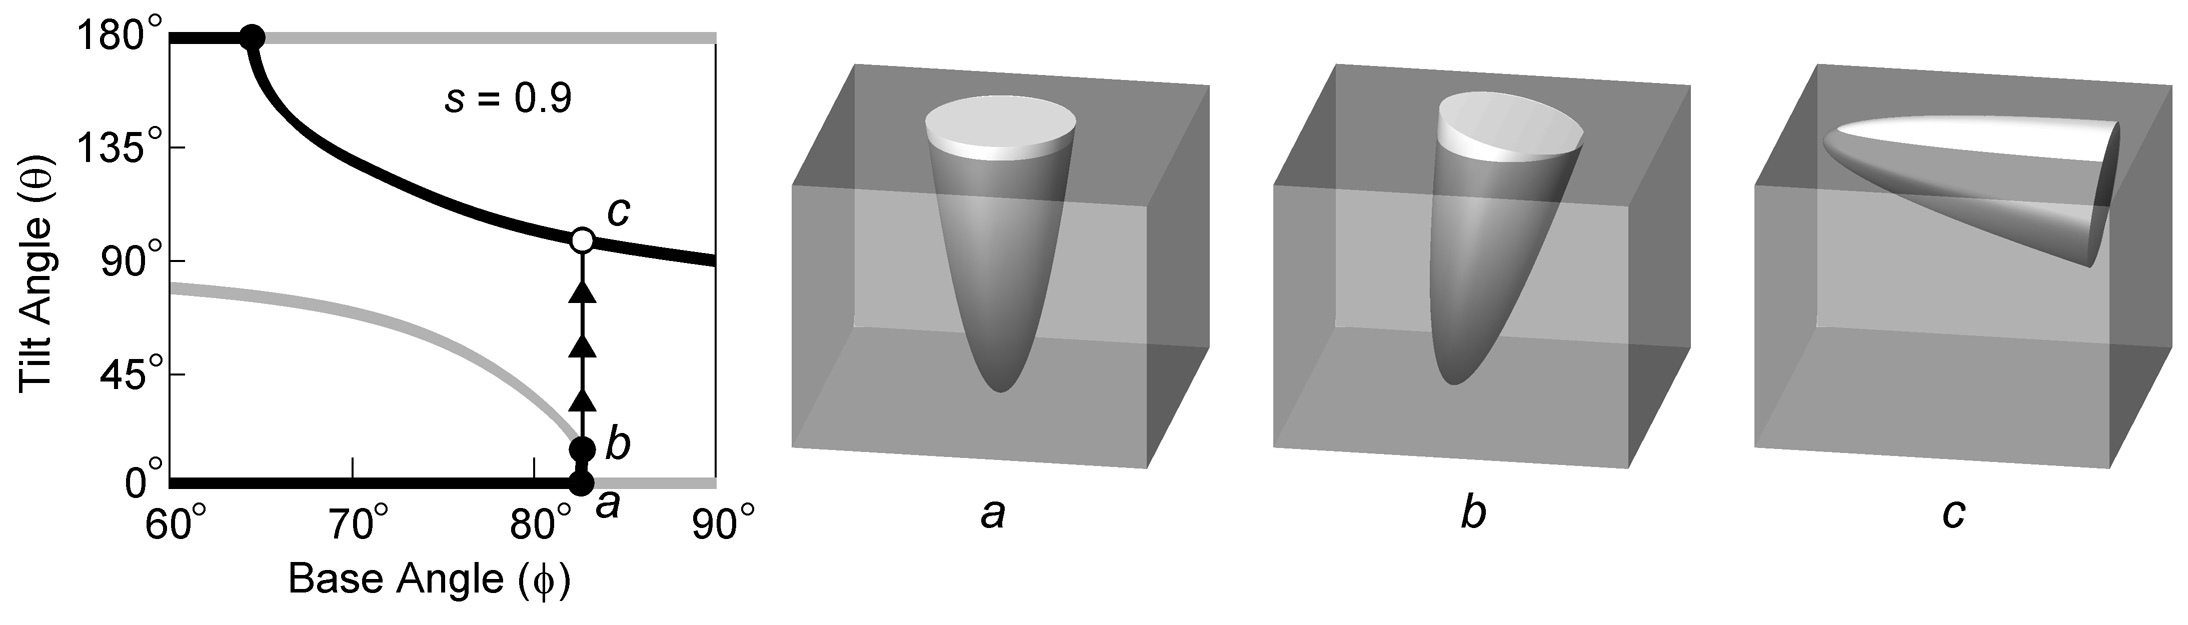
Fig. 8: 2188 x 625 pixels, 112 kilobytes |
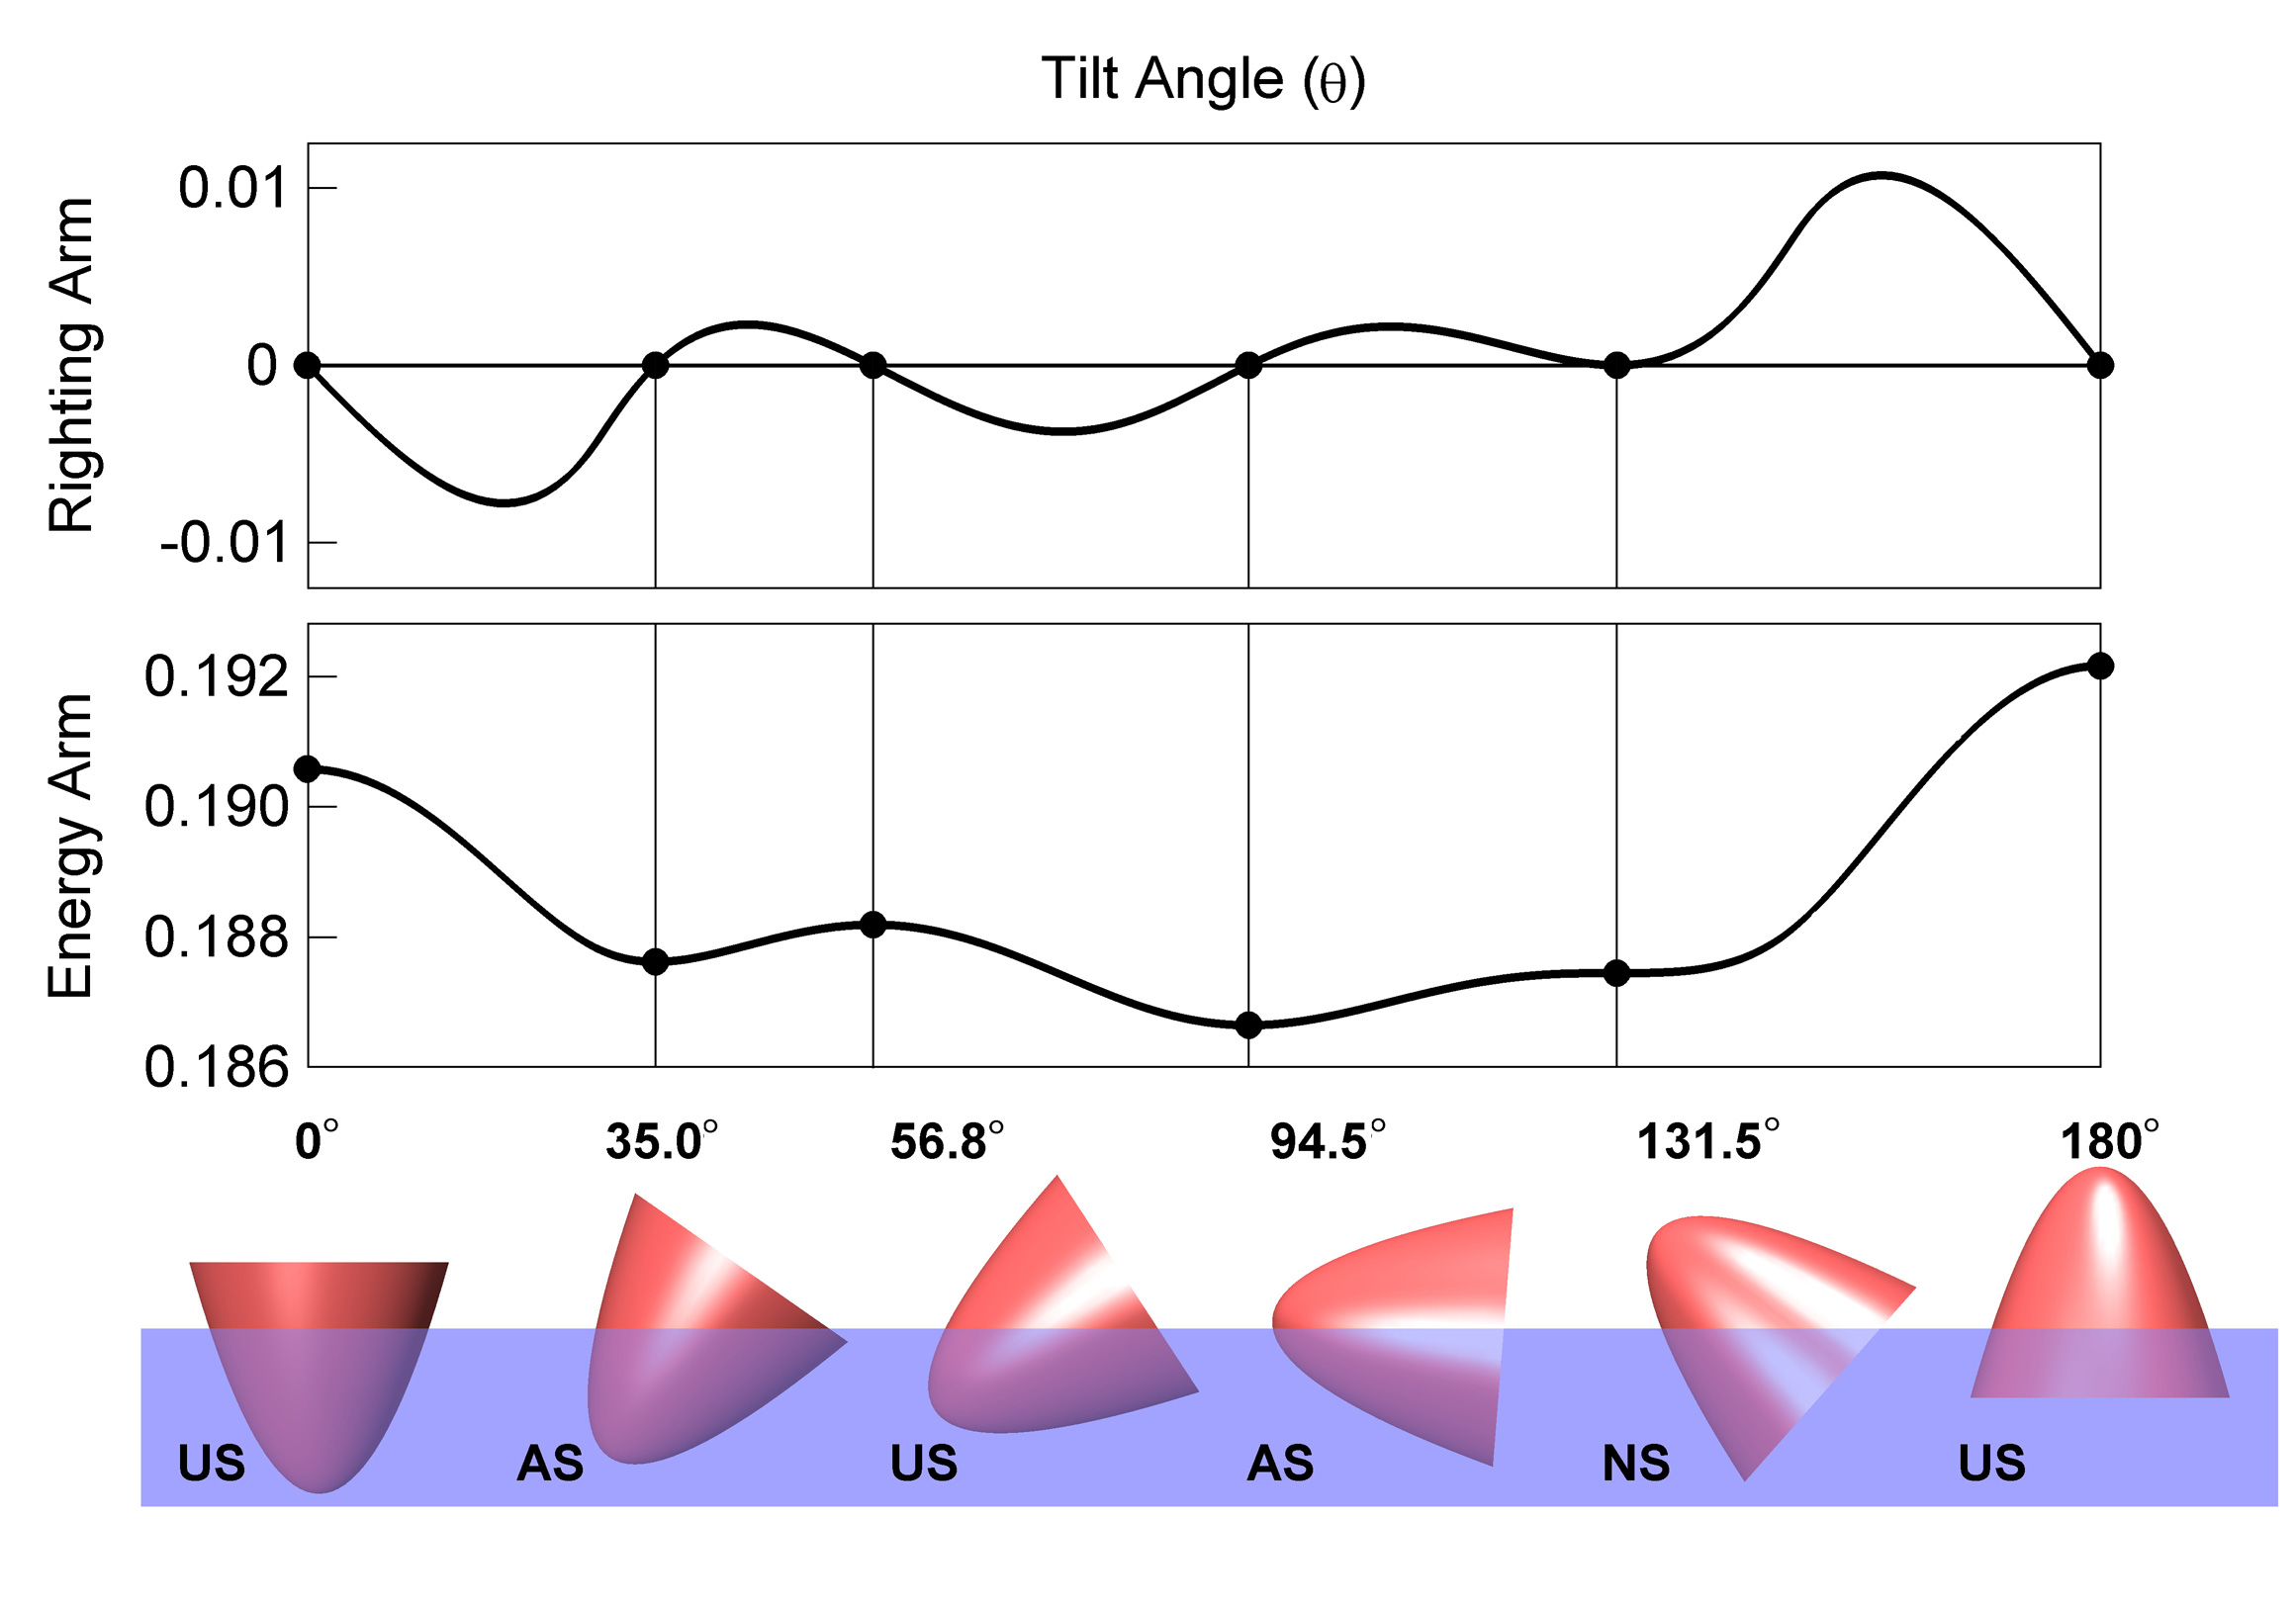
Fig. 3: 2321 x 1625 pixels, 347 kilobytes 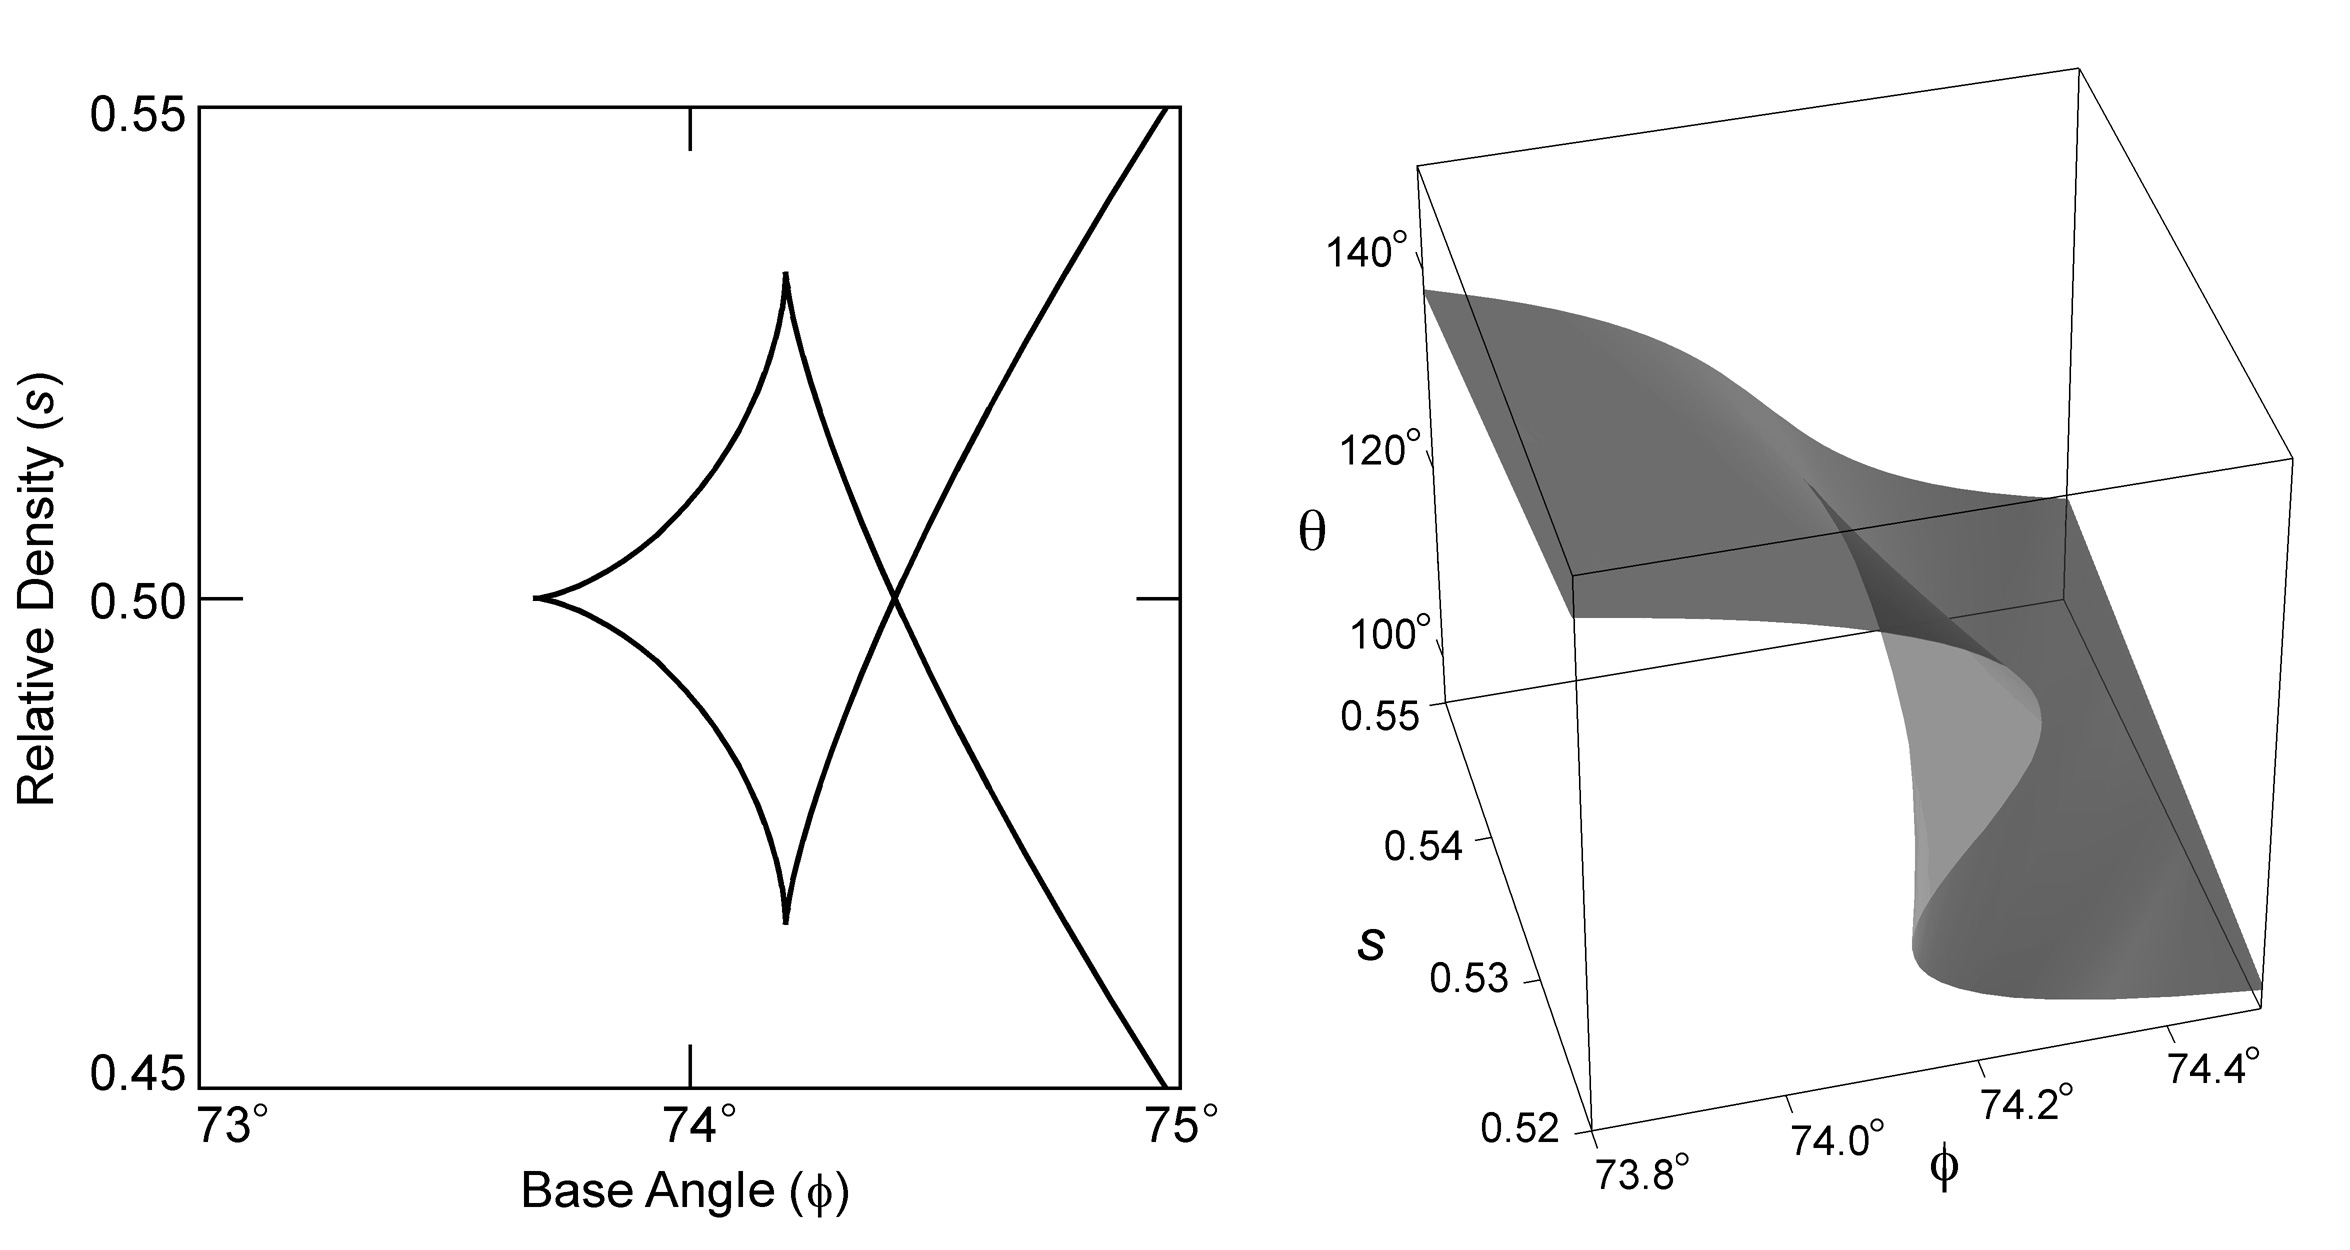
Fig. 6: 2350 x 1250 pixels, 200 kilobytes 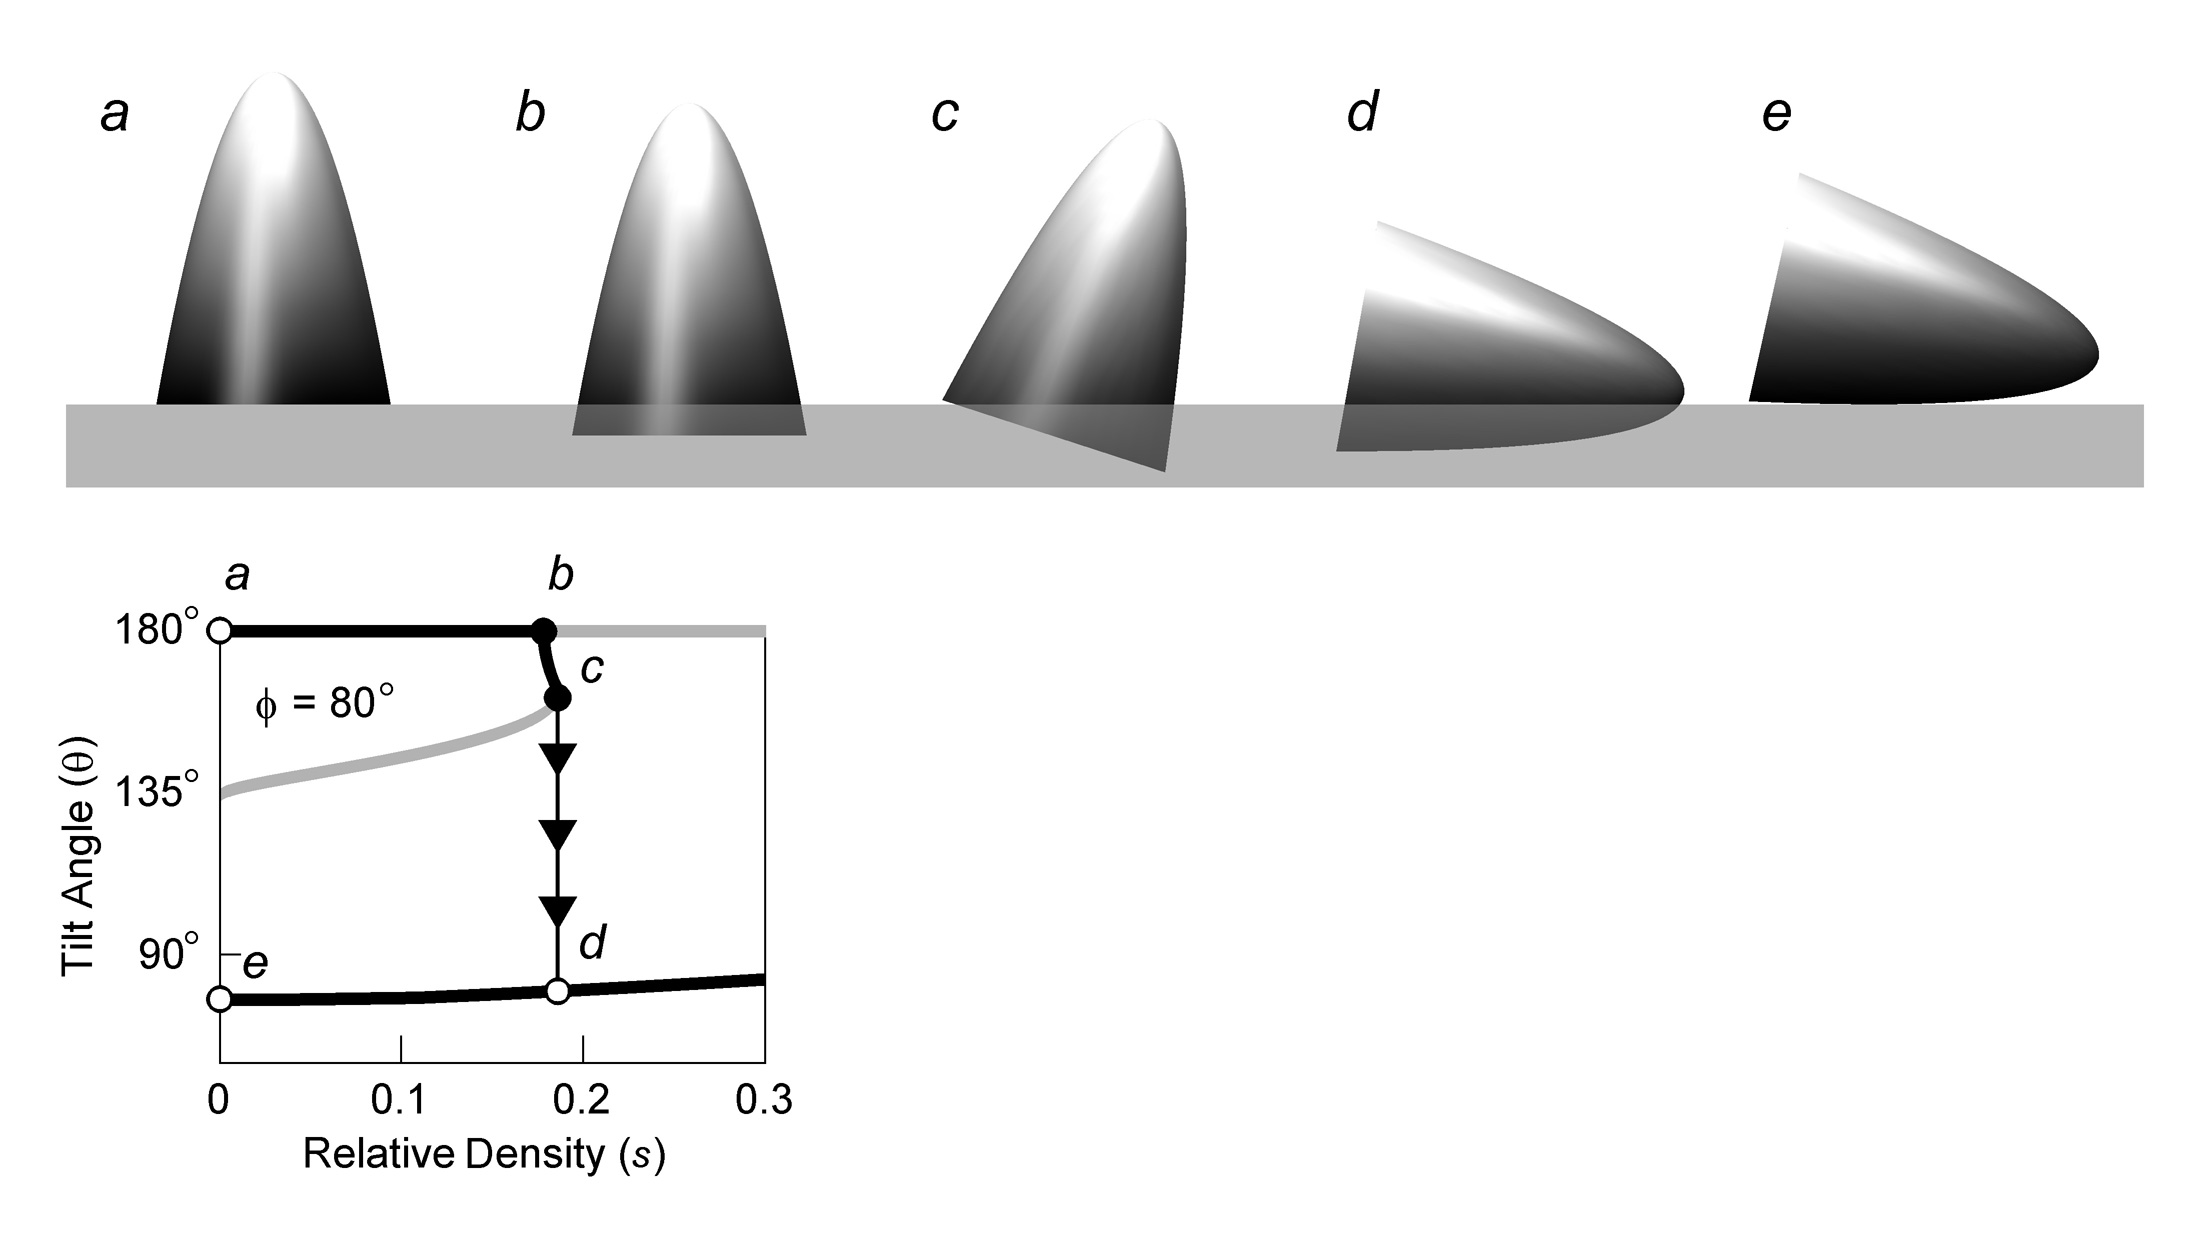
Fig. 9: 2188 x 1250 pixels, 134 kilobytes |
|
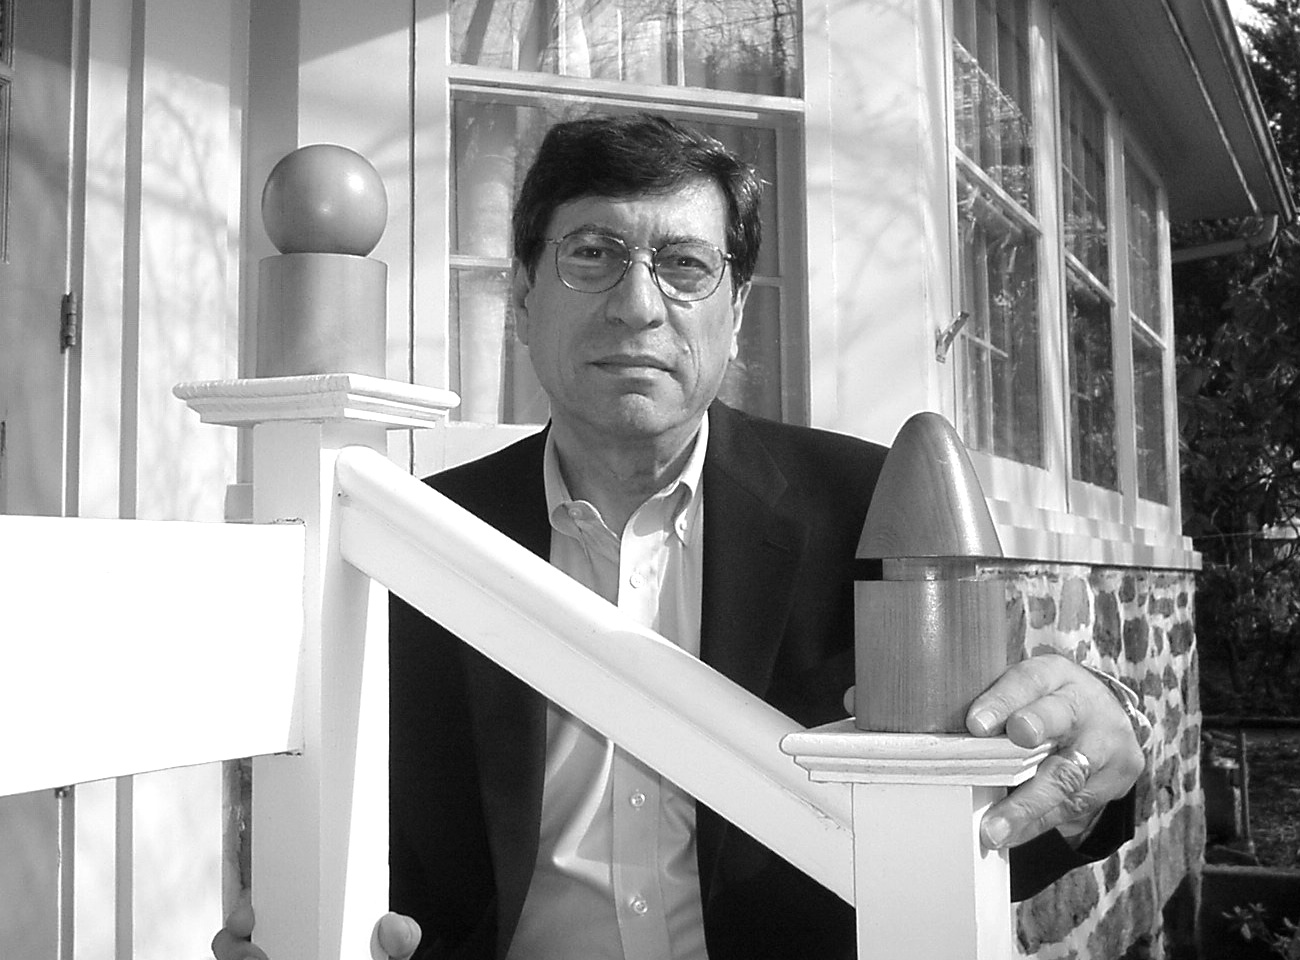
Photograph of Author (Chris Rorres)
The author is shown with two Archimedes-inspired finials he designed for his fence at home. The top one is a sphere atop a cylinder illustrating the so-called “tombstone” theorem that Archimedes considered his most important, that the volume and surface area of a sphere are both two-thirds, respectively, of the volume and surface area of its circumscribing cylinder. The bottom finial illustrates a theorem that Archimedes used for his research in floating paraboloids; namely, that the volume of a right paraboloid is one-half the volume of its circumscribing cylinder. |